A strong understanding of the return rate dynamics gives eCommerce businesses critical information that helps them optimize operations, enhance customer satisfaction, and drive profitability.
However, by using only your own eCommerce return rates as reference, it is unlikely that you can make the most informed decisions regarding your returns management strategy.
This article serves as a benchmark study on return rates. While it may not cover every detail, it should provide valuable insights into your return performance. We will examine the return rates by industry, examine common causes of returns, and offer strategies for improvement based on the factors influencing these rates.
By the end of the article, we hope you can get insights into the eCommerce return rate that you can eventually apply to your return management strategy.
What are eCommerce Returns?
The idea of eCommerce returns is no different from brick-and-mortar returns. It is represented in percentages and reflects the number of returned products relative to the total amount of orders sold by the eCommerce brand. The formula is as follows.
Return Rate = (No. of Returns / Total Number of Orders) x 100%
The average return rate for the eCommerce industry typically ranges from 20-30%. Compared to the traditional brick-and-mortar stores at around 8%, this figure presents to be 2 to 3 times of the norm.
Similarly, another metric called the Return Merchandise Authorization rate, or RMA rates can be used to look at returns. It works similar to eCommerce return rate but takes into account the formal authorizations to return a defective or unwanted item (having an RMA number) rather than the actual returns made by the customer. However, the logic is quite similar.
While the numbers may seem threatening, it is also important to acknowledge that eCommerce returns are far more common than you think. It is an essential part of your eCommerce business. According to the National Retail Federation, online returns accounted for $212 billion in 2022, around 16% of all online sales.
A better way to think of it: A certain eCommerce return rate is a healthy indicator of customer engagement, while too high can be detrimental. Then, it begs the next question: How should one understand eCommerce return rate?
Just Like a Magnifying Glass
By tracking eCommerce returns, businesses can gain valuable insights into customer behavior, product quality, and overall operational efficiency.
Viewing them through return rates reveals essential information about the shopping experience that your eCommerce business offers. For instance, elevated return rates in specific product categories may highlight product quality issues, sizing discrepancies, or misleading product descriptions. This then encourages businesses to delve deeper into the data instead of simply accepting high return rates as setbacks.
Instead of fearing these return rates, companies should develop effective returns management strategies, which we will cover in the next section.
Thinking Return Rates as Cohorts
To gain deeper insights into return rates, consider analyzing them through the lens of cohort analysis. This approach allows businesses to segment returns based on specific customer groups or purchase periods, hence achieving a better understanding of return behaviors.
Your Return Policy Matters
Your return policy plays a vital role in shaping the customer experience and influencing return rates. A transparent, customer-friendly return policy not only encourages purchases but can also alleviate the negative impact of returns. However, a lenient policy can also be reflected in the form of higher return rates than your competition.
eCommerce Return Rates and Trends
Diving into eCommerce return rates requires looking into benchmarks. Fortunately, industry groups and companies have published statistics on average return rates, offering valuable insights into trends across different aspects influencing the return rates. Let’s look into the most recent benchmarks together.
eCommerce Return Rates by Industry
The most obvious choice of benchmarking will be via industry. Our research founds 3 sources of comparison for now: Statistica, Shippo, and Mailmodo.
1. Statistia
According to Statista’s latest data in 2024, each eCommerce category has distinct return rates, with an industry-wide average of 20%. The clothing and apparel category leads with the highest return rate at 26%. Here is the return rate ranking by category:
- Clothing: 23%
- Shoes: 16%
- Accessories: 12%
- Food & beverages: 12%
- Consumer electronics: 10%
- Cosmetics & body care: 10%
- Books, movies, music & games: 9%
- Furniture & household goods: 9%
- Toys & baby products: 9%
- Household appliances: 8%
- Pet products: 8%
- Sports & outdoor products: 8%
- Bags & luggage: 7%
- Stationery & hobby supplies: 7%
- DIY & garden products: 6%
2. Shippo
In a 2023 report from the shipping aggregator Shippo, the average eCommerce return rates by industry were also highlighted. Apparel again represented the most significant portion of returns while other selected categories presents relatively lower numbers:
- Apparel – 17%
- Electronics – 9%
- Jewelry – 8%
- Beauty & skincare – 4%
3. Mailmodo
Mailmodo’s blog article provided additional insights into eCommerce return rates, showing the following category-wise return rates updated to 2022:
- Apparel – 10.01%
- Beauty – 4.99%
- Electronics – 8.28%
- Health and Wellness – 4.20%
- Jewelry – 8.31%
- Sports & Outdoor – 6.10%
What can we see?
From these numbers, some generalizations can be made. The fashion industry consistently experiences the highest eCommerce return rates, typically ranging from 20% to 40%. This is supported by CoreSight Research, as they cited that apparel return is prone to return reasons such as size/fit (53% of respondents), color (16%) and damage (10%). It is also important to know that customers purchase wearables online by looking at descriptions and images, which explains the ease of mismatches and higher returns of this category as well.
eCommerce Return rates tend to diminish for higher-priced items, which can be explained as the higher pricing prompts more cautious, thoughtful purchasing. For electronics, returns may arise from defective products or user errors. In the case of home goods and furniture, issues related to size, quality, and shipping damage are common. For crafted items, missing parts and quality control can be a frequent cause for returning the product.
In contrast, jewelry, beauty, and skincare products enjoy the lowest eCommerce return rates, with return factors are often more related to quality assurance and individual preferences as they tend to be less of a necessity.
eCommerce Return Rates by Country
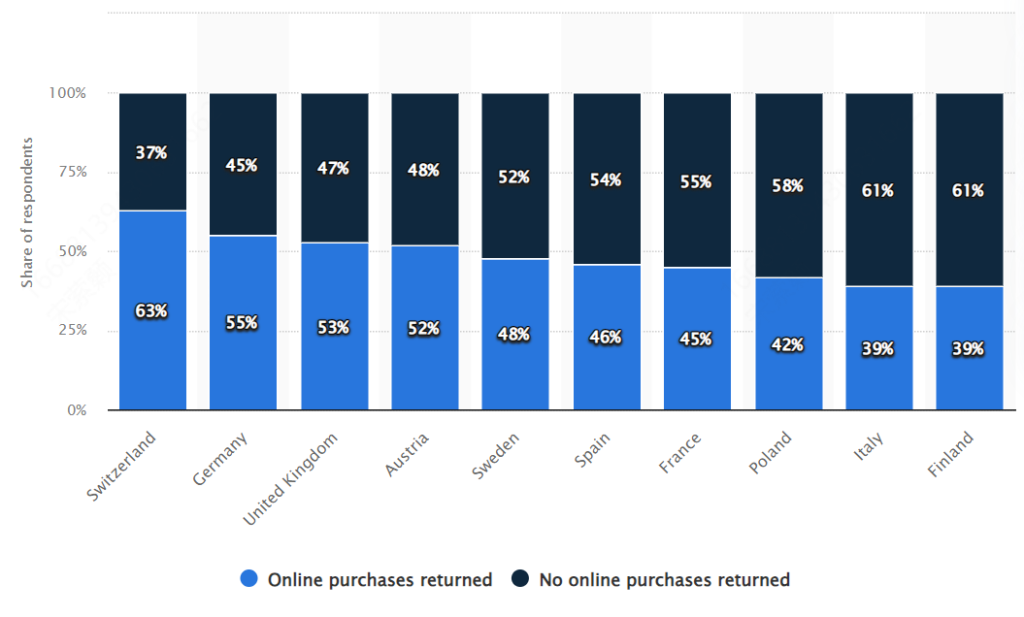
Another possible benchmark measure can be by country. For example, the blog by ECN team reviews the eCommerce returns pattern by EU region, with data as of June 2023:
Interestingly, the top 5 countries with the highest returns rate are Switzerland (63%), Germany (55%), United Kingdom (53%), Austria (52%), and Sweden (48%). Customers from these countries are likely to return their purchases, and one can also observe clear variations of eCommerce return rates by countries.
eCommerce Returns by Reason
There can be different reasons behind return behavior in eCommerce channels. However, the most common ones, as suggested by Invesp, are:
- 23% received “wrong item”
- 22% product received looks different
- 20% received “damaged product”
- 35% other reasons (such as change of mind, sizing and quality issues, delayed shipping, or others)
The implications reflect the need for improved accuracy in order fulfillment and better product representation. However, depending on the product description, order management and product category, these statistics may vary significantly as well. These may be areas where you should work out to optimize your eCommerce returns rate.
Seasonal Spikes in Return Rates
Holidays have a dramatic effect on return rates in eCommerce. For the holiday seasons, return rates can rise up to 35%, significantly higher than during regular shopping days. This increase can be attributed to increasingly impulsive buying behaviors and gift purchases that may not suit the buyer’s taste. This also applies to promotional offers.
Rising Customer Expectations for Returns
Customers have increasingly high expectations regarding the returns process, whether they are making a purchase online or not.
According to Simicart, 63% of customers expect a return window of up to 30 days, while 23% anticipate a minimum of 14 days. Additionally, 76% of first-time customers who have a smooth return experience are likely to shop with that retailer again.
Besides, Invesp highlights the importance of a well-defined returns policy, noting that around 49% of retailers now offer free return shipping. 67% of shoppers check the returns page before making a purchase. 58% of customers are desiring a “no questions asked” return policy, while 47% prefer free and easy-to-print return labels.
The Problem with “Serial Returners”
Serial returners pose a significant challenge in eCommerce, as many customers buy multiple versions of an item with the intention of returning some. According to Mailmodo, 67% of online shoppers are classified as “serial returners,” indicating that retailers must effectively address this issue to prevent losses.
Preventing Return Fraud
Retailers should also be vigilant about return fraud, which involves fraudulent activities related to forcing a return from a specific business, such as wardrobing, use of “fake” receipts, product switching, etc.
For every $100 in returned merchandise, retailers on average lose $10.3 towards fraudulent returns. As cited by Shopify, these fraudulent returns result in substantial losses for 13% of all retailers, making return fraud prevention a top priority in eCommerce.
Strategy to Manage eCommerce Returns
With the benchmarks reviewed, it is also important to outline key considerations and actionable strategies to help businesses tackle the issue of returns head-on.
Look Beyond the Numbers, But the Reasons
While benchmark data by category provides a useful reference point, it is essential to recognize that they are just approximate averages.
The “why” but not the “how much” in eCommerce return rates are more important, as they vary significantly as the categories change, the returns policy change, and it can also be positively or negatively affected by the quality of product listing.
In eCommerce, several factors can contribute to the higher return rates. Unlike shopping from a physical store, online shoppers lack the tangible experience, leading to purchasing errors and greater returns. Besides, it also leads to a greater reliance on product descriptions and images that are offered by the online retailer.
If you notice a spike in return rates, particularly related to your product listings, online shopping experience, you should do something about it. Setting accurate expectations and improving the overall online experience are some of the positive ways to go.
Evaluate Your Returns Policy
While committing to a free return shipping policy may seem advantageous, it is also essential to assess if your business can realistically deliver this service effectively. Additionally, you should also consider the possibility of reselling returned items.
Data indicates that major online retailers tend to have lower return rates compared to broader eCommerce averages. This can be driven by more restrictive return policies, better control over product quality, and trust towards established marketplaces and brands.
To facilitate a better eCommerce returns policy, consider the following:
- Level of clarity in your returns condition
- Economic viability on “free return shipping”, i.e. Is it too costly or not to do it?
- Common customers complaints about the returns experience
- Comparison with competitors’ returns policy
- Measures to prevent return fraud
- Frequency of reviewing and updating your returns policy
Each eCommerce merchant has unique return policies and procedures that will impact return rates. The goal should never be to eliminate all customer returns. Instead, allow flexibility from time to time while keeping your bottom line in shape.
Keep in mind, policies should be reviewed and updated from time to time to reflect changes in returns management view. Nearly 6 out of 10 retailers are changing their returns policies in 2022 as an effort to optimize returns, while 80% of U.S. customers surveyed said they would switch to a different retailer with more favorable return policies. The logic behind this is that the returns process instills a sense of security in their purchasing decisions.
Leverage Third-Party Tools
Utilizing third-party tools, such as TrackingMore’s advanced tracking APIs, can streamline the tracking process for returns and ensure that customers are informed every step of the way.
ReturnGO is a great success story related to returns management. It is an AI-powered returns management platform and benefits well from our solution.
By partnering with TrackingMore, ReturnGO achieved remarkable results, reducing tracking costs by an impressive 90% and expediting app development time by 78%. The integration of TrackingMore’s APIs allowed ReturnGO to offer complete end-to-end tracking capabilities, enhancing customer satisfaction through real-time tracking updates and personalized branded tracking portals.
ReturnGO’s partnership with TrackingMore showcases how the use of third-party tools can drive better returns management. For more insights on improving your returns management, you can learn more by reading our previous blog article on returns management.
>>> Read More: The Ultimate Guide to Returns Management
Final Words
Understanding return rates across different eCommerce industries is vital for retailers aiming to manage their operations effectively. By benchmarking against the average eCommerce return rates and implementing strategies to reduce returns, businesses can enhance customer satisfaction and improve their bottom line.
As the eCommerce landscape continues to evolve, staying informed about return trends will be essential for long-term success. You may also consider a third-party tool like TrackingMore to help you gain unparalleled visibility in your forward and reverse logistics operations.
The TrackingMore team shares insights on logistics tracking technology, industry trends, and e-commerce logistics solutions to help businesses streamline shipment tracking and enhance customer post-purchase experience.